Hi there!
I have issues with my mouse IFNg ELISpots similar to this post:
From reading previous troubleshooting conversations, I can see that a probable reason could be the in vivo activation of T cells... And if this is the case, what is the solution?
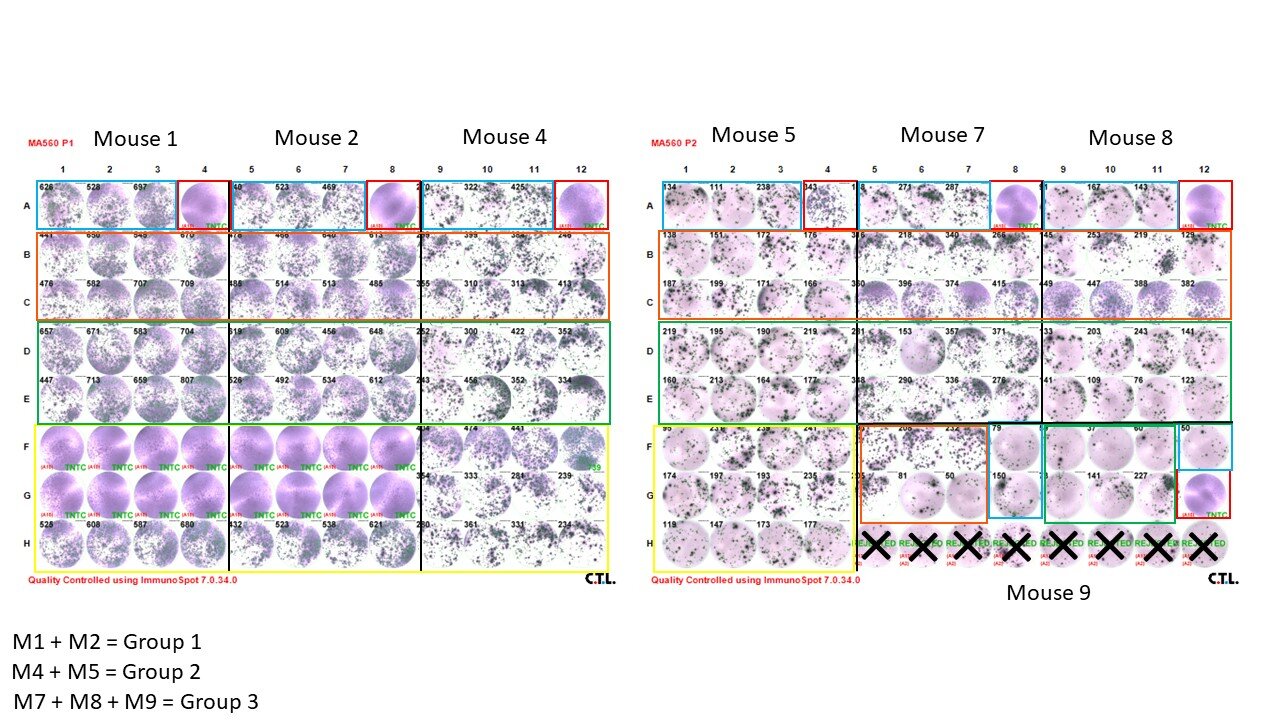
My latest ELISpot had crazy spot numbers for my 'cells alone' wells, for example 617 and 477 for one treatment group, 339 and 161 for another group. From looking at the data, it seems like each mouse has a similar trend of overall spot count. For example, the mouse with 617 spots in the 'cells alone' wells (average triplicate), had the following spot counts in the 7 different peptide wells: 600, 800 (TNTC), 800 (TNTC), 657, 654, 619, 577; the mouse with 477 spots in the 'cells alone' wells had the following spot counts in the 7 peptide wells: 529, 800 (TNTC), 800 (TNTC), 541, 583, 499, 549; and as a last example, the mouse with 161 spots in the 'cells alone' wells had the following spot counts: 154, 200, 202, 179, 206, 181, 159. As you can see, there is a trend in each mouse, which I assume could be due to in vivo T cell activation as previously mentioned? Just to different extents...?
Previous ELISpot experiments have shown lower spot counts overall, so I'm not sure what could have been done differently this time... (I always make sure I pipete the 'cells alone' wells very carefully, trying to isolate these wells so to not mix them with peptide-containing wells, and I do the same with the positive control wells (concanavalin A). I suppose I will have to see what my results are like in my next ELISpot, but I just thought I'd ask in case there is some sort of explanation. I am particularly curious as to what can be done if the T cells are indeed activated in vivo? Does this simply mean that the wells will all have many spots and, if so, what can be done about this? Would lowering splenocytes/well help? (We use 500,000 splenocytes/well).
Thank you in advance for your help!